Case Study
22% Lift in Conversion Rate for a Shopify Premium Home-Wellness Brand
Data-backed PDP experiments improved revenue per visitor.
Redesigned location page
Updated: 13 October 2025
The Project
The Challenge
The site was well-designed and functioned smoothly, but performance had plateaued. The low-hanging fruit was already gone.
To move the needle, we needed to understand why visitors hesitated, what details mattered most to them, and how to guide them toward higher-value behaviors—not just a single purchase, but ongoing subscription engagement.
Our challenge was twofold: (1) Identify micro-optimizations that could make a measurable difference on a mature site. (2) Ensure every improvement supported higher LTV, not just AOV or CR.
Our Approach
We collaborated closely with the brand's designer and developer to plan and execute a series of high-impact A/B tests using Visually.io. Our process combined data analysis, UX research, and customer insight to form clear hypotheses for each test.
We mapped the entire user journey—from browsing to checkout—and identified opportunities to: strengthen the visual hierarchy of subscription options; simplify decision-making on the PDP; bring trust and social proof closer to conversion moments; improve content flow above and below the fold.
Every idea was implemented with design precision and technical accuracy, ensuring visual consistency while maintaining site speed and stability.
Gallery
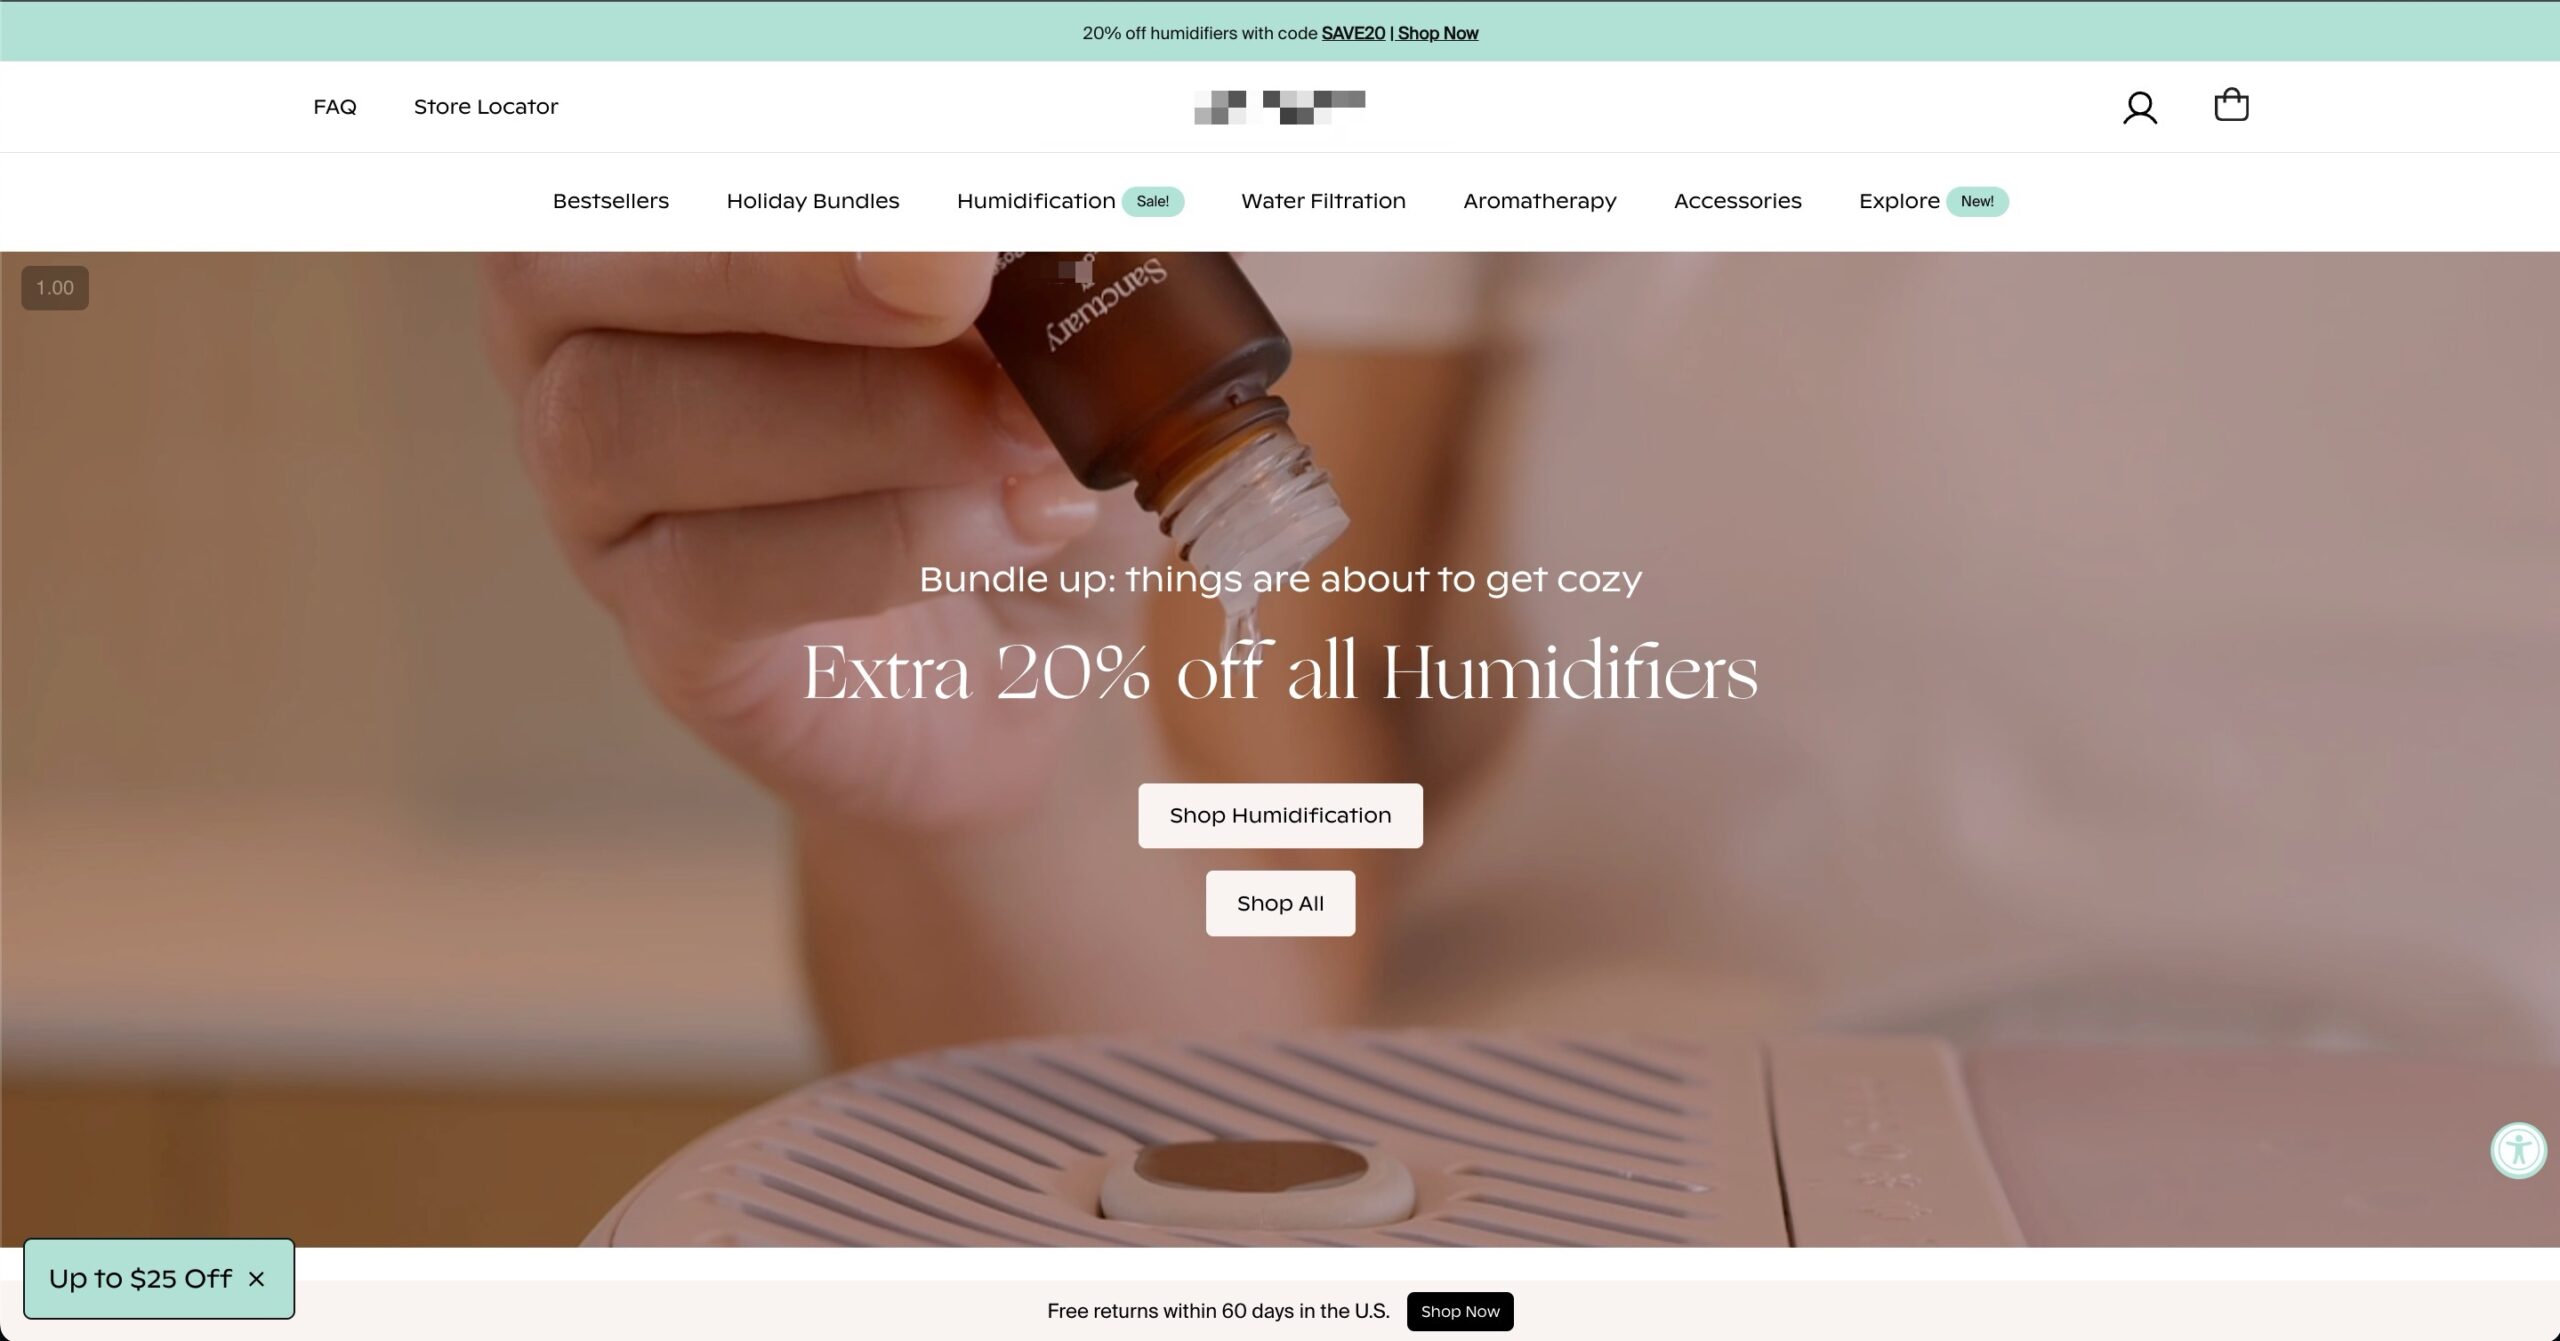
Figma design
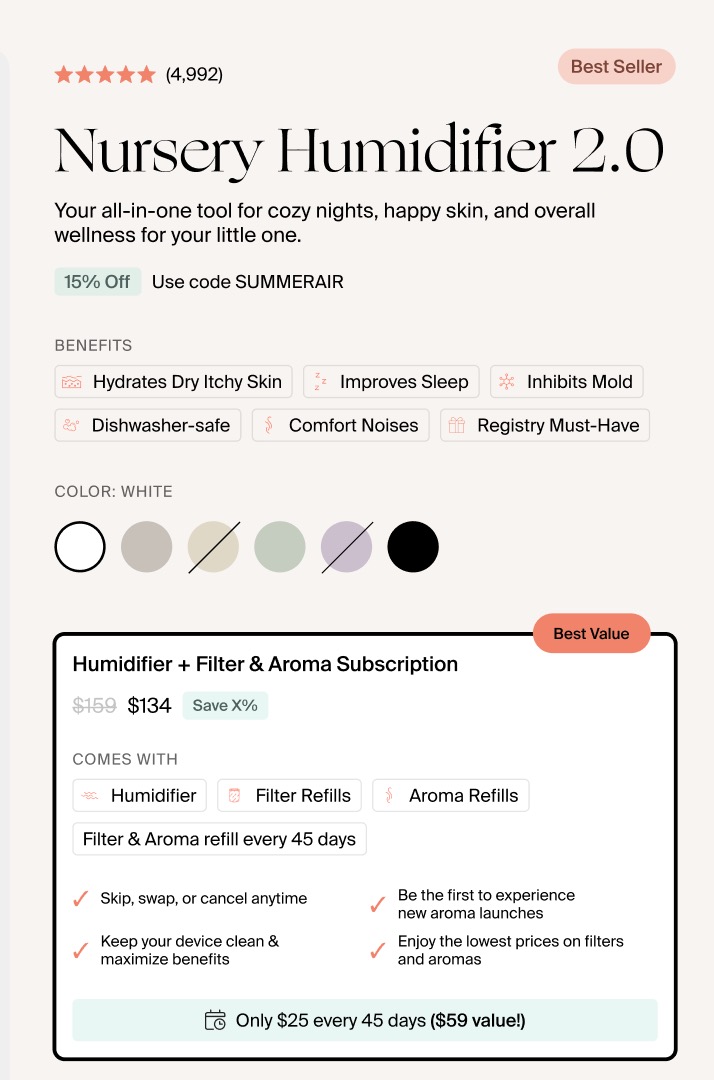
Test setup
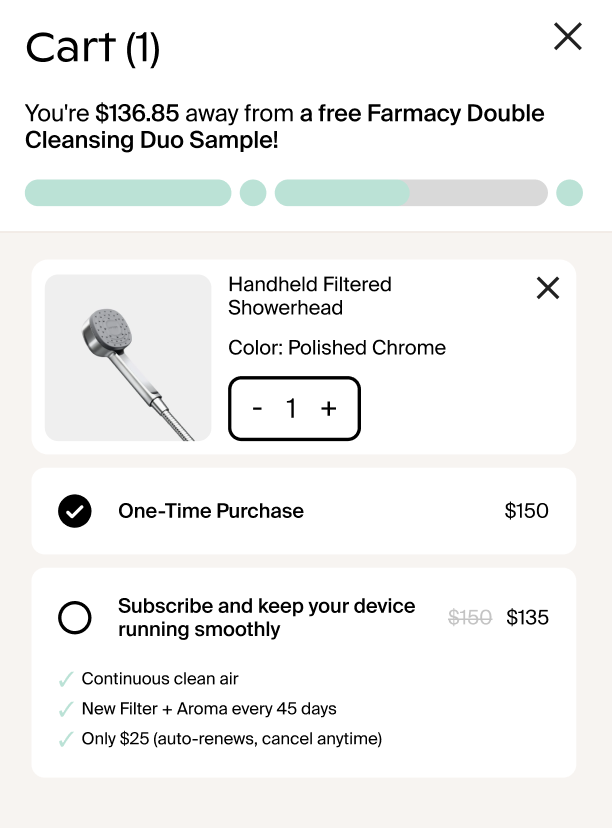
Screenshot
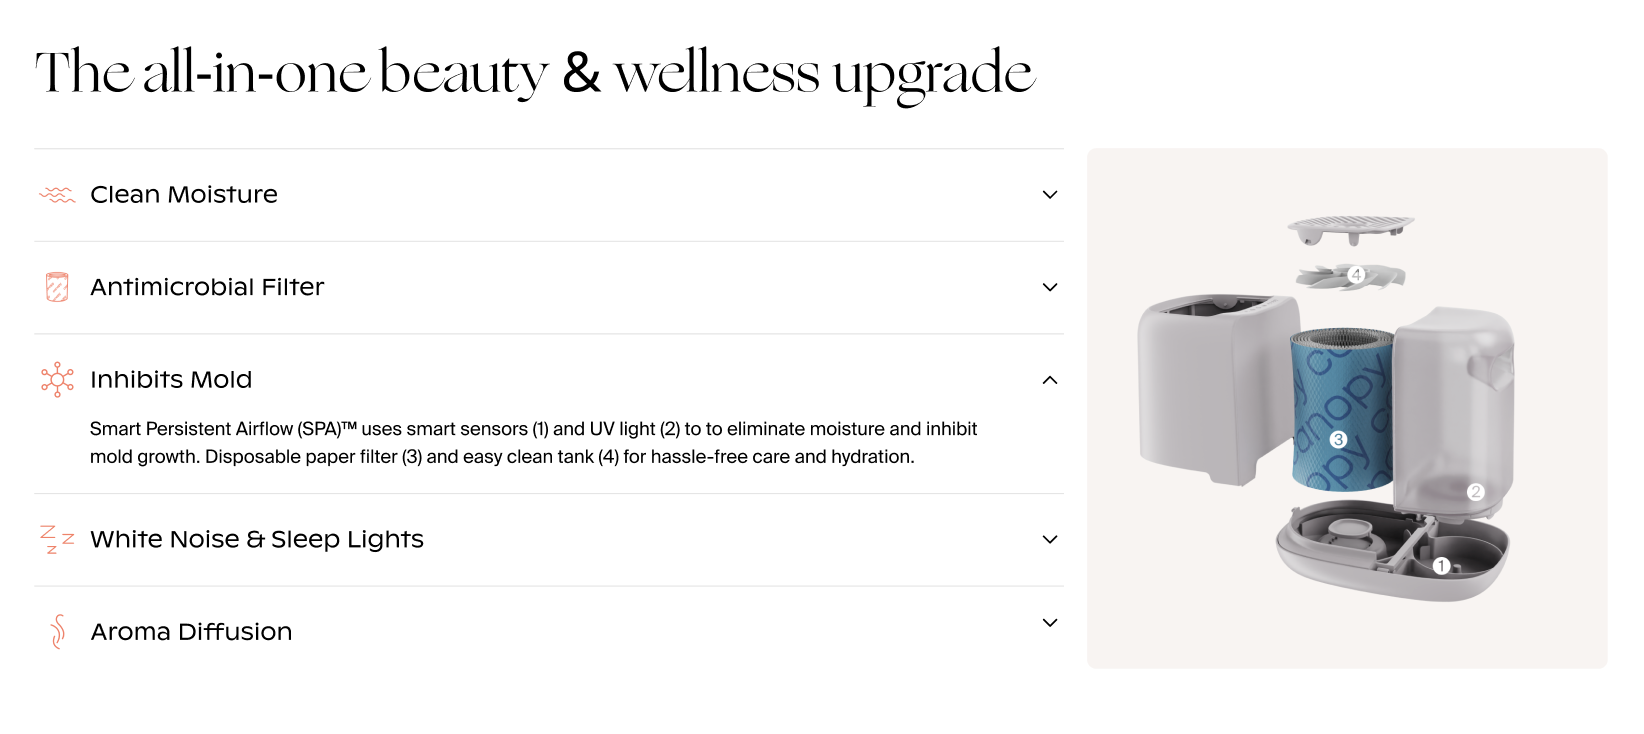
Screenshot
The Tests
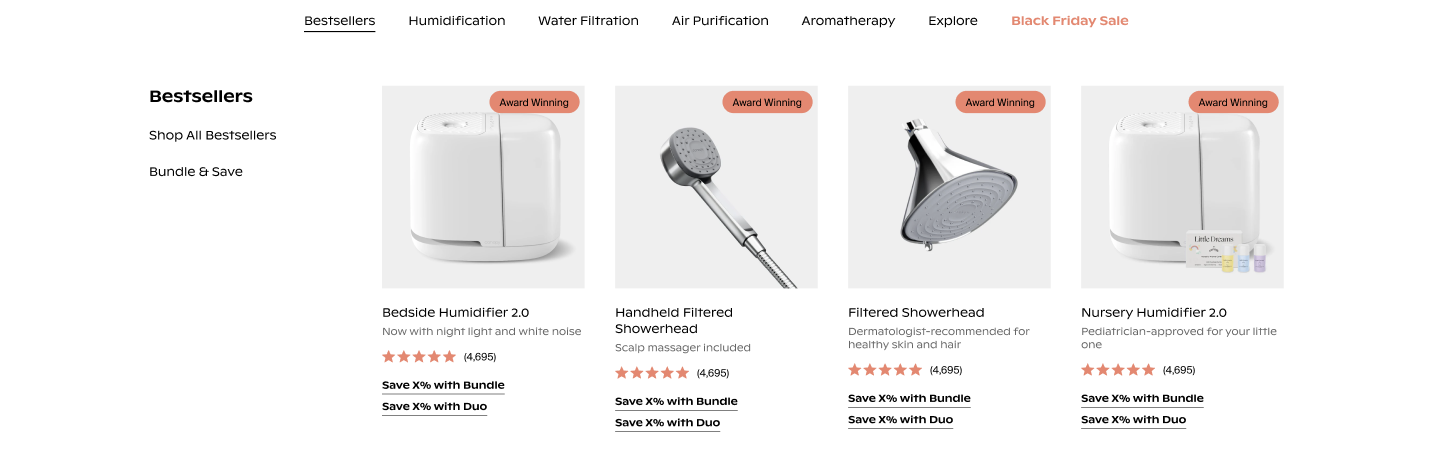
Over several months, we tested multiple sections of the site: Collection Page (clarified product positioning and improved filter hierarchy); Product Pages above and below the fold (refined messaging, restructured variants, repositioned testimonials); Add-to-Cart options (simplified subscriptions, made recurring benefits more prominent); Checkout testimonials (added persuasive elements to reduce last-minute drop-offs).
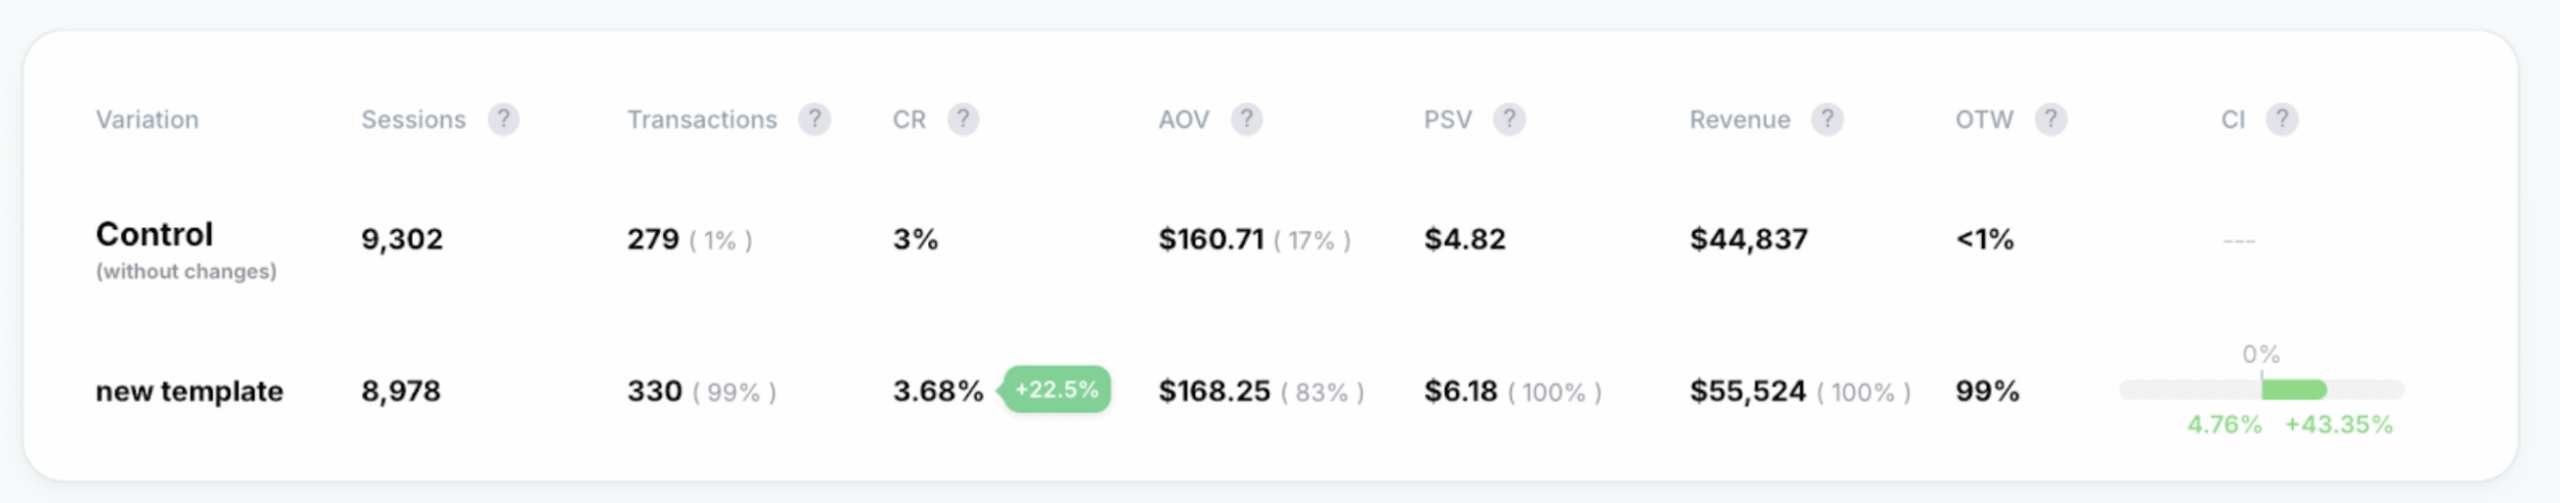
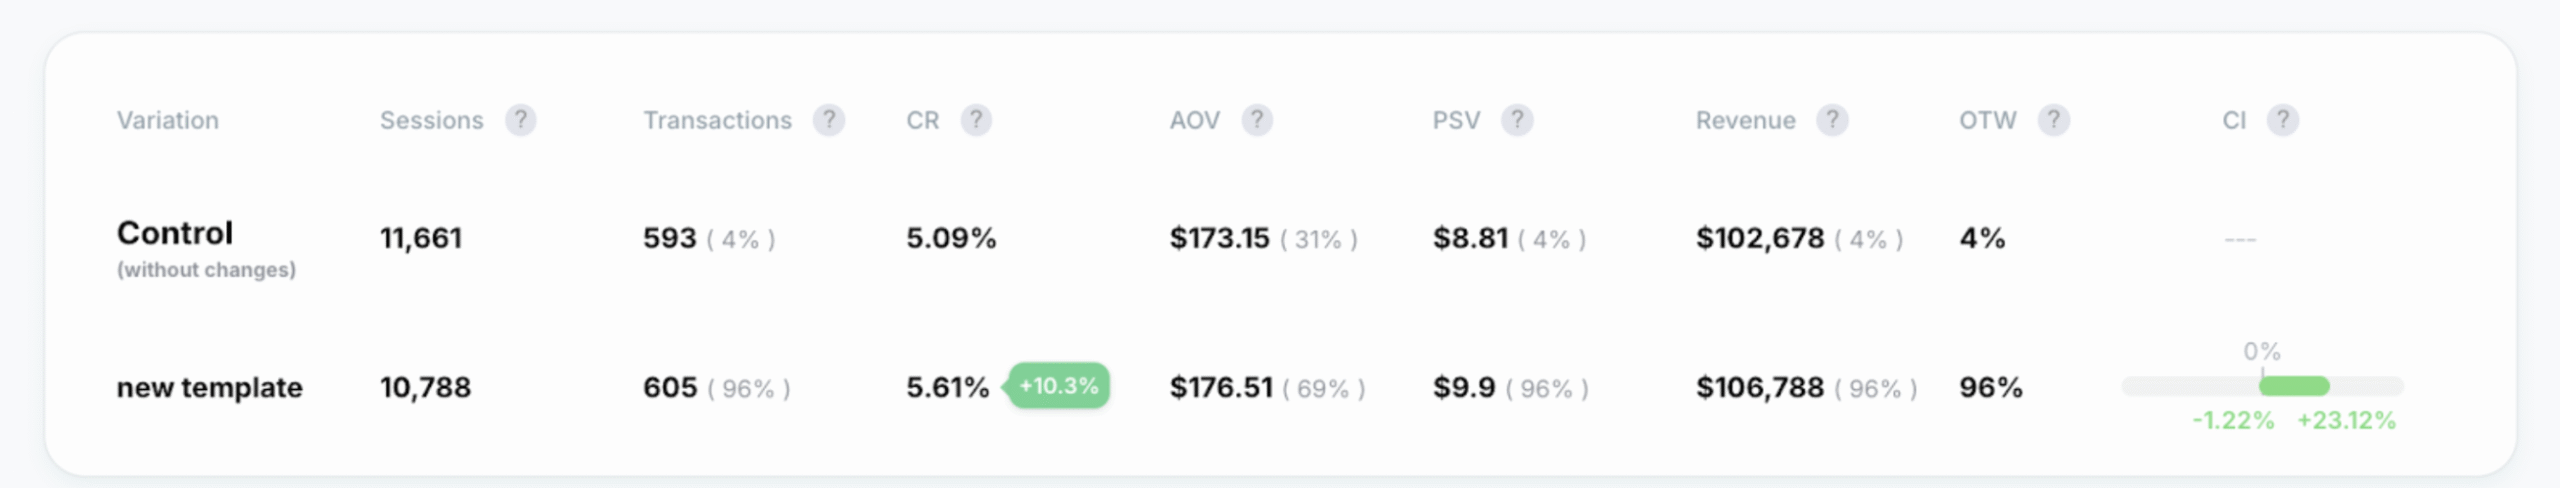
Not every variant won—that's exactly how we validated what truly influenced conversions and retention. The most successful tests showed +22.5% to +10% lifts in conversion rate, with corresponding increases in revenue per visitor and subscription adoption.
Result
A/B test results
Test results detail
+10% to +22.5% conversion lift on product pages
The experiments confirmed a strong return on testing investment: +10%–+22.5% conversion lift on the product pages; increased subscription selection and retention rates across tested products.
By focusing on behavior-driven design and LTV-oriented testing, we helped the brand convert more visitors and create longer-lasting customer relationships—without increasing ad spend.
Ready for Your Own Results?
Schedule a call. We'll review your funnel and show you what's possible.
SCHEDULE A CALLFree strategy session